Environmental Monitoring
Live parameter monitoring with alerts across connected sites.
A brand of POTAQUA Solutions
Real-time insights. Predictive intelligence. Preventive action.
AI-powered environmental monitoring
GREENode is a brand of POTAQUA Solutions. It connects sensors, gateways and cloud analytics into one monitoring layer for water, energy, gas and pipeline infrastructure — turning field data into decisions operators can act on.
GREENode is a brand of POTAQUA Solutions.
Solution areas
Live parameter monitoring with alerts across connected sites.
Level, flow and consumption visibility to prevent loss and overflow.
Equipment-level current, voltage and power monitoring.
Condition-based insight in place of reactive repair.
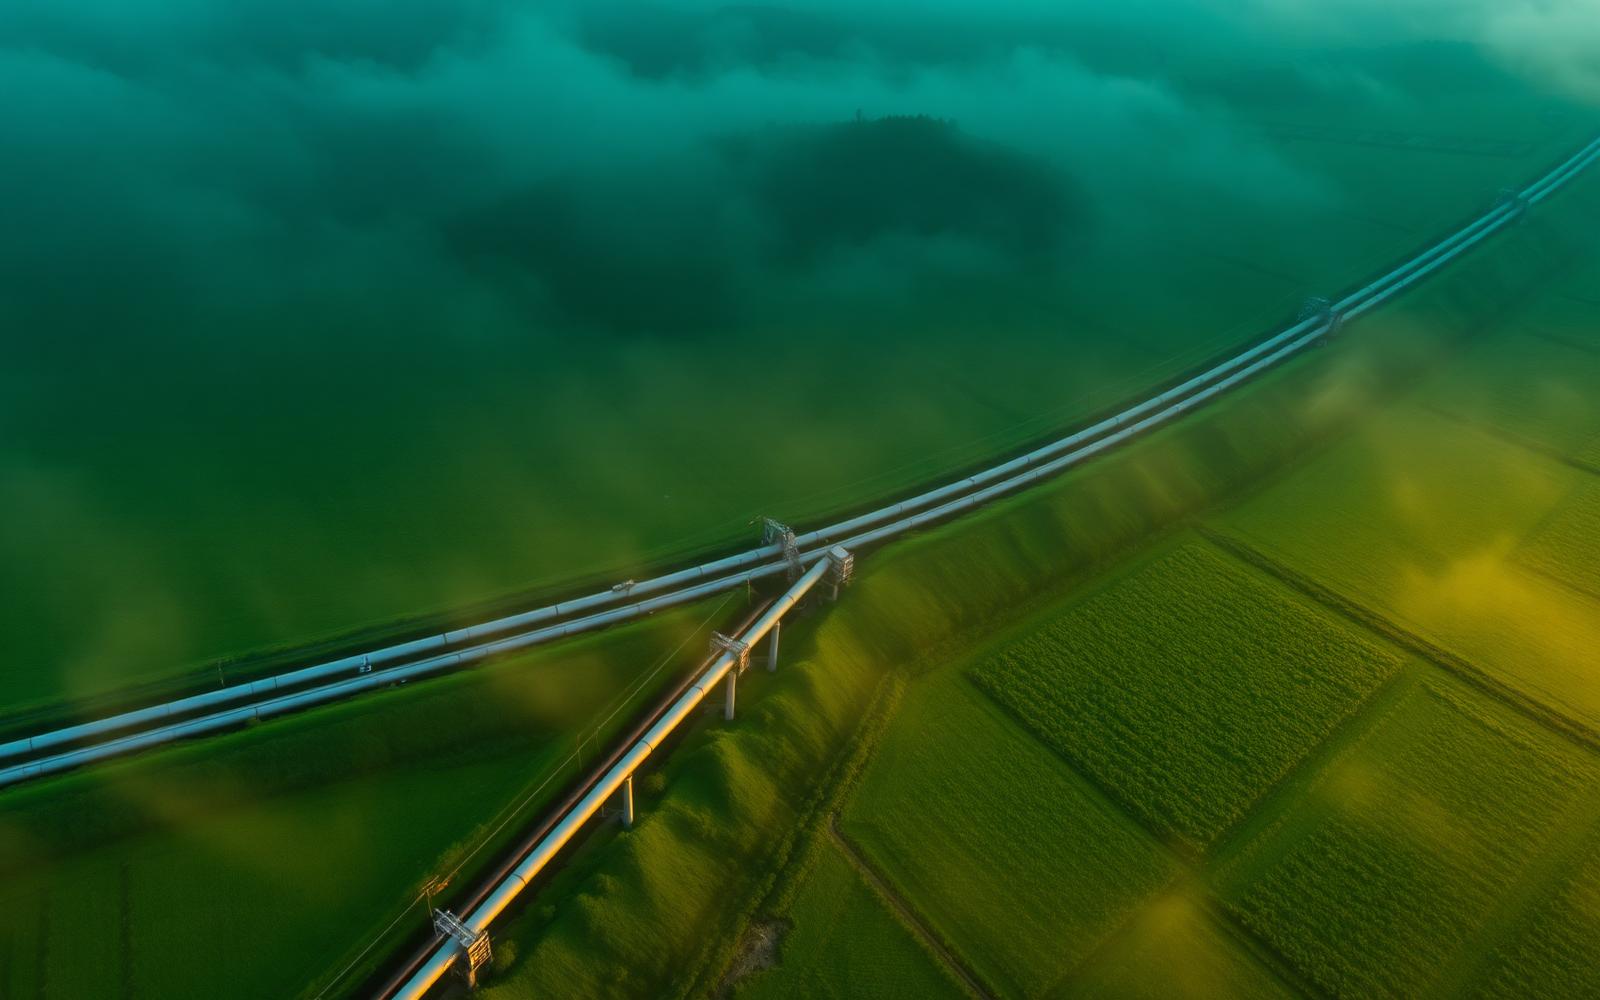
Pressure, flow and corrosion monitoring with leakage detection.
IoT gateways, local processing and secure 4G/LTE cloud transfer.
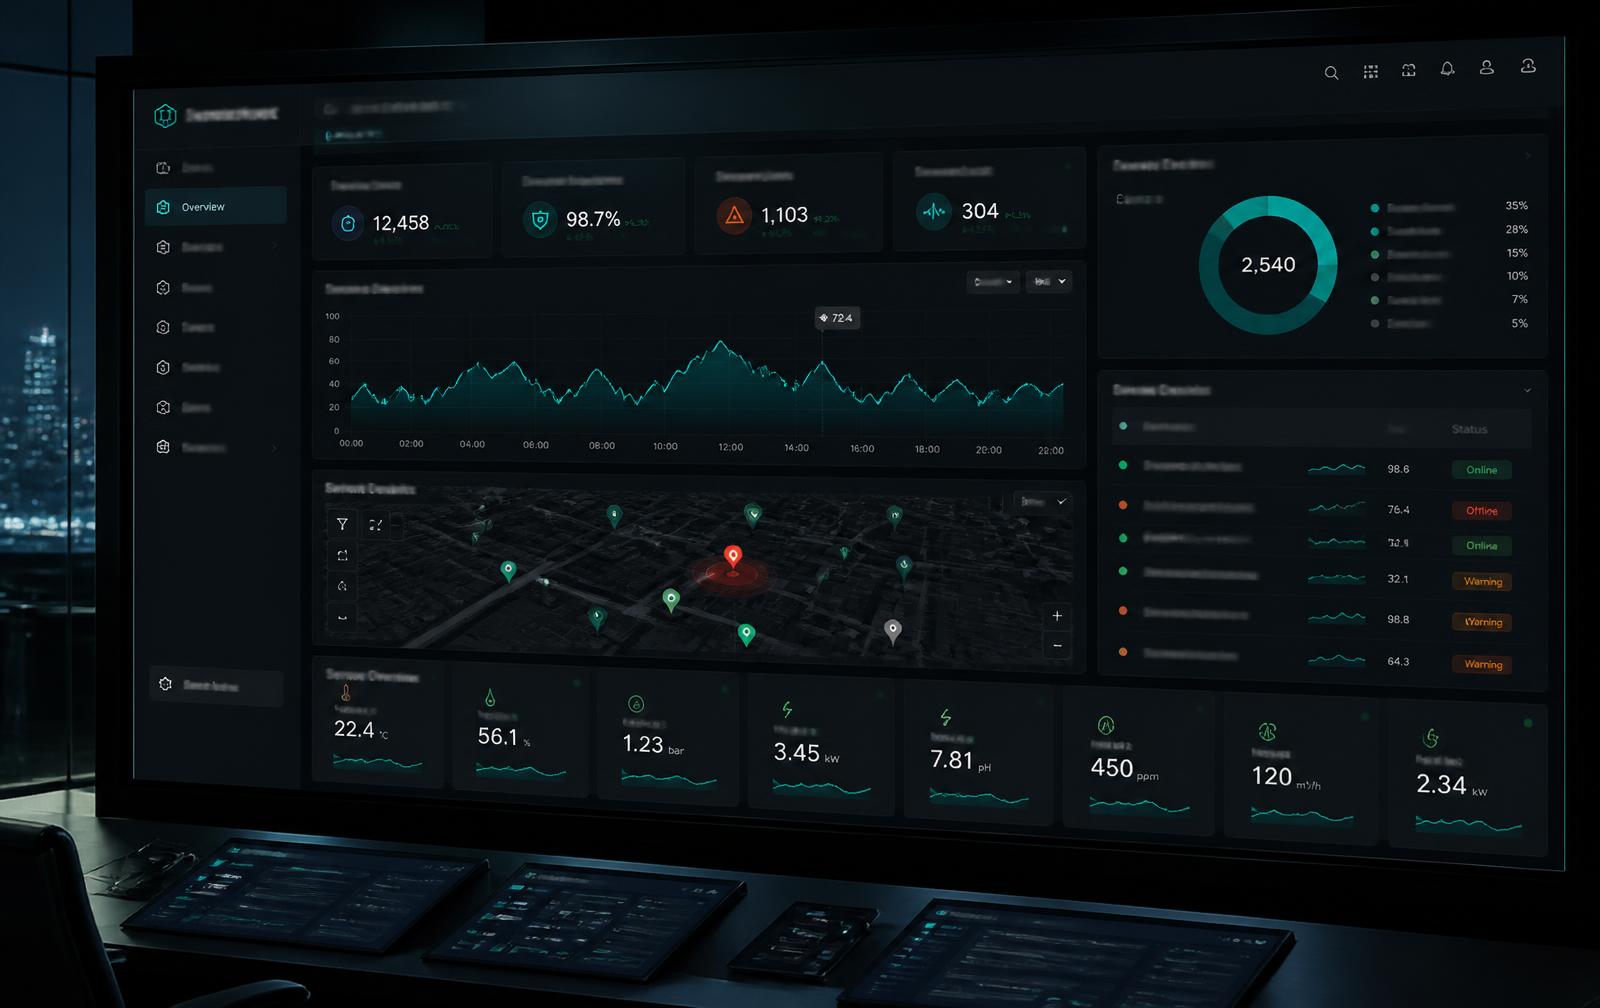
Dashboards, GIS asset maps and role-based user management.
SMS, email and app notifications when a parameter crosses limits.
End-to-end architecture
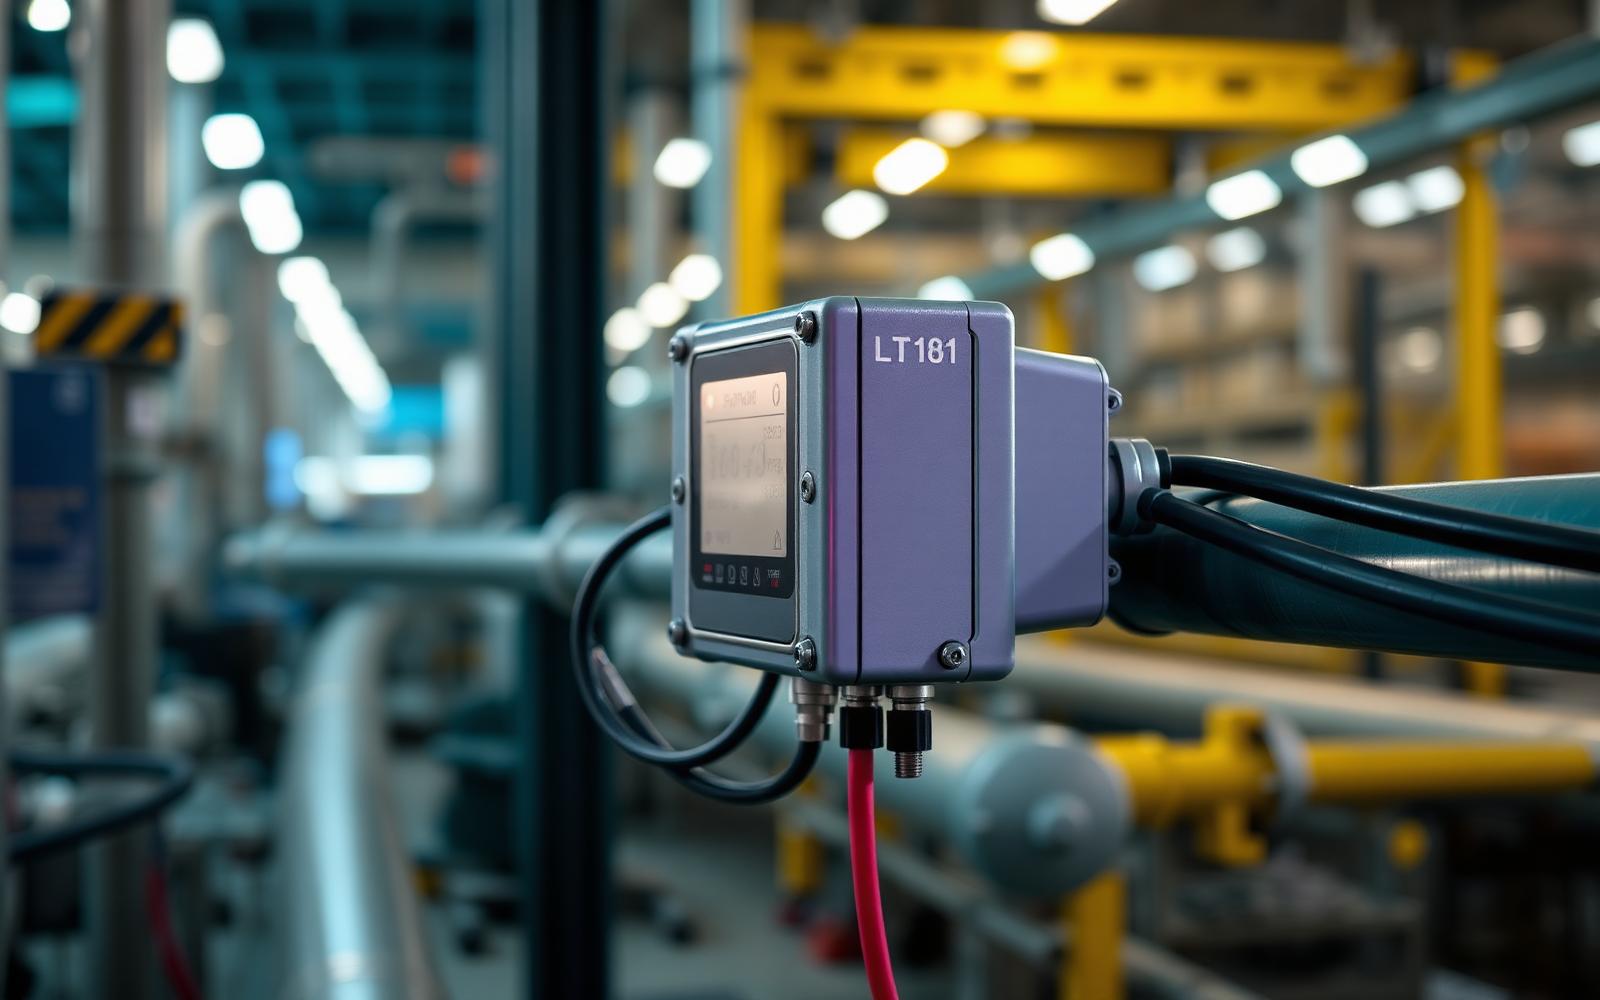
Field sensors capture the parameter in real time.
GREENode gateway acquires, processes and packages data.
Secure 4G / LTE transfer to the cloud platform.
Storage, analytics engine, alert engine, API integration.
Live values, trend analysis, historical reports, exports.
SMS, email and app notifications for risk conditions.
GREENode dashboard ecosystem
Real-time Monitoring
View live operational status.
Historical Trends
Analyse long-term performance.
Alarm Management
Instant notifications and alerts.
Report Generation
Automated daily, weekly and monthly reports.
GIS Visualisation
Track geographically distributed assets.
User Management
Role-based access control.
GREENode systems
Diesel Pump Failure Prevention
Energy Consumption Visibility
Water Loss & Tank Overflow Prevention
Pipeline Health & Leakage Detection
Predictive Maintenance System
Smart Water Intelligence System
Energy Intelligence System
Gas Intelligence & Safety System
Tell us which asset you want visibility on — water, energy, gas or pipeline — and we will map the monitoring approach.